
Tableau

CTA partnered with Tableau to develop CTA’s Tableau Library

Now you can analyze and visually depict your organization’s aggregated data on homelessness. See at a glance which strategies have the most impact on your community.
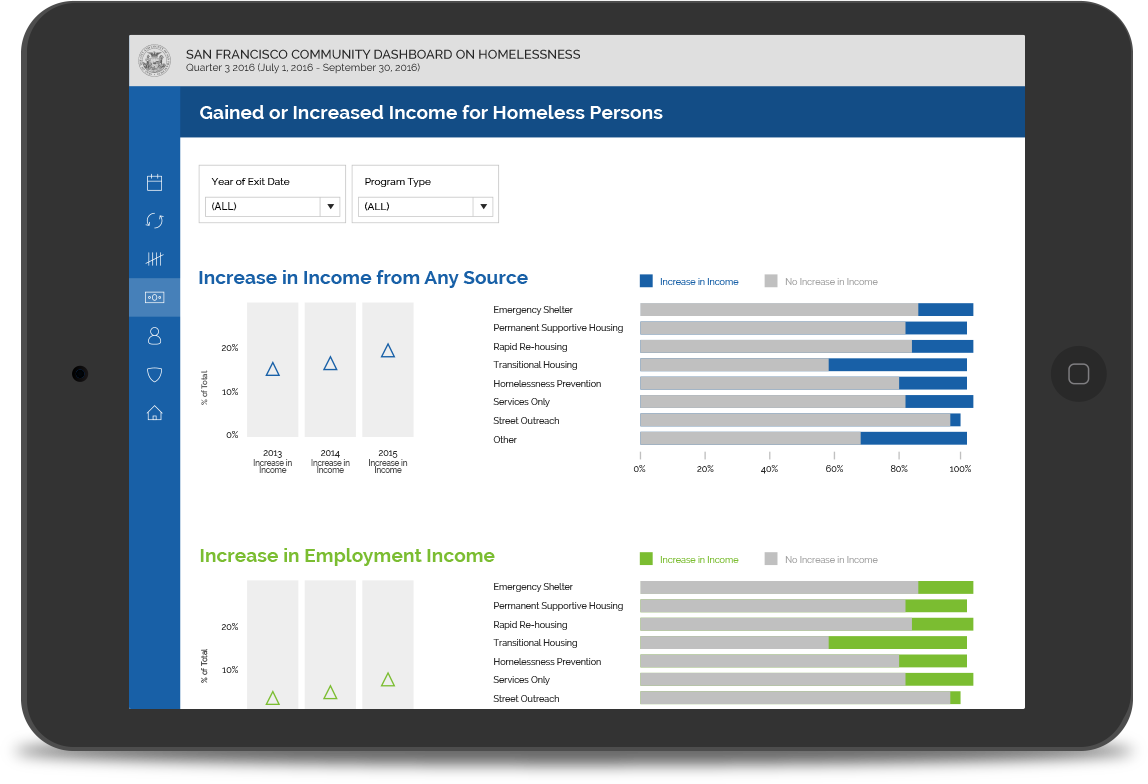

Tableau Reports

CTA’s Tableau Library:
Reports that evaluate critical homeless data

Factors
See how your HUD numbers have changed over time and understand which factors contribute to that change.
Dashboards
View dashboards without leaving your website and select which reports you want to share with your community.
CTA Tableau Library
Don’t see what you need from the library of reports? Let CTA build you a custom report.

Human services agencies and non-profits rely on CTA’s Tableau Library to evaluate and visualize their HMIS & homeless data, including:

  • Demographics and Outcomes
  • Length of time homeless
  • Recidivism rate of homelessness
  • Number of homeless persons
  • Jobs and income growth
  • Successful housing placement
  • HUD Performance Measures Dashboard
  • Homelessness prevention and housing placement
play

Watch CTA’s Tableau Library in action

Monterey County

CTA helped Monterey County combine data

from the county’s 16 human services agencies to create a patient-centered system that reveals which programs have the most impact. See how using CTA’s Tableau Library to evaluate critical data led to better decision-making.

READ MORE

Spend less time going over the numbers, and more time acting on your data. Schedule a free 30 min demo.